Metabolit karotenoid dan dinamika transkriptom yang mendasari warna bunga pada marigold (Tagetes erecta L.)
Marigold (Tagetes erecta L.) is an important ornamental plant with a wide variety of fower colors. Despite its economic value, few biochemical and molecular studies have explored the generation of fower color in this species. To study the mechanism underlying marigold petal color, we performed a metabolite analysis and de novo cDNA sequencing on the inbred line ‘V-01’ and its petal color mutant ‘V-01M’ at four fower developmental stages. A total of 49,217 unigenes were identifed from 24 cDNA libraries. Based on our metabolites and transcriptomic analyses, we present an overview of carotenoid biosynthesis, degradation, and accumulation in marigold fowers. The karotenoid content of the yellow mutant ‘V-01M’ was higher than that of the orange inbred line ‘V-01’, and the abundances of the yellow compounds lutein, neoxanthin, violaxanthin, zeaxanthin, and antheraxanthin were signifcantly higher in the mutant. During fower development, the carotenoid biosynthesis genes were upregulated in both ‘V-01’ and ‘V-01M’, with no signifcant diferences between the two lines. By contrast, the carotenoid degradation genes were dramatically downregulated in the yellow mutant ‘V-01M’. We therefore speculate that the carotenoid degradation genes are the key factors regulating the carotenoid content of marigold fowers. Our research provides a large amount of transcriptomic data and insights into the marigold color metabolome. Abbreviations MEP 2-C-methyl-d-erythritol-4-phosphate pathway DEGs Diferentially expressed genes DXS 1-Deoxylulose-5-phosphate synthase DXR 1-Deoxylulose-5-phosphate reductionomerase GGPPS Geranylgeranyl pyrophosphate synthase PSY Phytoene synthase PDS Phytoene desaturase Z-ISO 15-Cis-ζ-carotene isomerase ZDS ζ-Carotene desaturase (ZDS) CRTISO Carotenoid isomerase LCY-B β-Cyclase HYD-B β-Hydroxylase LCY-E ε-Cyclase HYD-E ε-Hydroxylase CCD Carotenoid cleavage dioxygenase NCED 9-cis Epoxy carotenoid cleavage dioxygenase oooo 1 Beijing Key Laboratory of Greening Plants Breeding, Beijing Institute of Landscape Architecture, Beijing 100102, China. 2 Beijing Key Laboratory of Development and Quality Control of Ornamental Crops, Department of Ornamental Horticulture, China Agricultural University, Yuanmingyuan Xilu 2, Beijing 100193, China. 3 Jiangsu Vocational College of Agriculture and Forestry, Nanjing, China. 4 These authors contributed equally: Huali Zhang and Shiya Zhang. *email: [email protected];
Carotenoids play an important role in photosynthesis, and their degradation produces a series of plant volatiles, as well as strigolactones and abscisic acid p hytohormones1,2 . Moreover, carotenoids are widely used in the food and pharmaceutical industry; for example, lutein and similarly structured carotenoids can protect retinal cells in the eye against oxidative stress, and a number of studies have suggested that the supplementation of lutein can maintain eye health and lower the risk of various chronic eye diseases3 . Marigold (Tagetes erecta L.) is native to Mexico and South A merica4 . In addition to its use as a potted plant, a landscaping plant, and a cut fower, marigold is an important source of lutein. Te consumption of lutein-rich foods can efectively reduce the chance of developing macular degeneration, cataracts, and atherosclerosis, as well as the development of certain cancers5,6 ; therefore, the international demand for lutein is constantly increasing. Lutein is the main pigment in marigold petals, accounting for up to 90% of the total carotenoids in these fowers7 . Marigold is one of the main raw materials from which lutein is extracted, making it a promising cash crop. In plants, the precursor of carotenoid biosynthesis is derived from the 2-C-methyl-d-erythritol-4-phosphate (MEP) pathway, which takes place in the plastids. Te biosynthesis of the frst carotenoid compound precursor, phytoene, requires four enzymes: 1-deoxylulose-5-phosphate synthase (DXS), 1-deoxylulose-5-phosphate reductionomerase (DXR), geranylgeranyl pyrophosphate synthase (GGPPS), and phytoene synthase (PSY). Another four enzymes participate in the catalytic reaction to transform colorless phytoene into red lycopene, namely phytoene desaturase (PDS), 15-cis-ζ-carotene isomerase (Z-ISO), ζ-carotene desaturase (ZDS), and carotenoid isomerase (CRTISO). Afer the formation of lycopene, the metabolic pathway divides into two branches. One of these branches results in the catalysis of lycopene by β-cyclase (LCY-B) and β-hydroxylase (HYD-B) to produce zeaxanthin, while the other branch involves LCY-B, HYD-B, ε-cyclase (LCY-E), and ε-hydroxylase (HYD-E), which function to produce lutein. In marigold fowers, LCY-E is expressed in the petals, and its expression is positively associated with lutein accumulation8 . Te accumulation of lutein in plants is also determined by its degradation. Te degradation of lutein and other carotenoids involves the carotenoid cleavage dioxygenase (CCD)9 and 9-cis epoxy carotenoid cleavage dioxygenase (NCED) enzymes10 . CCD performs a major role in the degradation of a series of xanthophylls, such as lutein, zeaxanthin, violaxanthin, neoxanthin, and antheraxanthin, whereas NCED specifcally catalyzes the degradation of zeaxanthin. In general, genes encoding carotenoid biosynthesis and degradation enzymes are expressed in specifc patterns in the various organs and at diferent developmental stages. Teir expression patterns are fnely regulated by various transcription factors, but only a few studies have explored these regulatory pathways in d etail 11 . Ralf et al. 12 found that an Arabidopsis thaliana APETALA2 (AP2)/ethylene-responsive element-binding protein transcription factor (AP2/ERF), RAP2.2, binds to the PSY and PDS promoters. Te rap2.2 knockdown mutant displayed a decreased level of PSY and PDS expression, in addition to a 30% reduction in its carotenoid content. A phytochrome-interacting factor (PIF) was also shown to bind to the PSY promoter and inhibit its expression13 . Similarly, a MADS box transcription factor, RIN (ripening inhibitor), was found to interact with the PSY promoter and participate in carotenoid accumulation in tomato (Solanum lycopersicum) fruit 14 . Tese transcription factors are known to regulate carotenoid accumulation in general; however, no transcription factors have been reported to regulate lutein biosynthesis or degradation specifcally. Te lutein contents of diferent marigold varieties can vary more than 100 fold, resulting in difering petal colors, which can be white, cream, yellow, and orange-red. We previously developed the marigold inbred line ‘V-01’, which has orange petals, and recently identifed a natural mutant derived from this population, ‘V-01M’, which displayed identical developmental and botanical characteristics to ‘V-01’, except that it produced yellow petals. Here, we used metabolome and transcriptome sequencing techniques combined with bioinformatics to analyze these two marigold genotypes and identify the genetic mechanisms underpinning their diferent fower colors. Tis work improves our understanding of the transcriptional mechanisms by which carotenoid accumulation and degradation are regulated. Results Carotene and xanthophyll accumulation in the petals of ‘V-01’ and its natural mutant ‘V-01M’. Te marigold inbred line ‘V-01’ (orange fowers) and its natural mutant ‘V-01M’ (yellow fowers) had very similar botanical characteristics, except for their petal color (Fig. 1A). Marigold fower development can be divided into four stages (Fig. 1B); in the frst stage, the ligulate fowers are tightly packed and green (Stage I), afer which the outermost ligulate fowers begin to expand (Stage II). Next, the ligulate fowers elongate, with pigmentation starting to appear from the outermost layer (Stage III), and fnally, all of the ligulate fowers expand and spread evenly to form the
marigold inforescence (Stage IV). We found that the orange variety ‘V-01’ and its natural mutant ‘V-01M’ had visible color diferences starting from Stage III, resulting in completely diferent fower colors at Stage IV. To analyze the diferences in color at the biochemical level, we assessed the accumulation of carotenoids in the Stage-IV ligulate fowers of ‘V-01’ and ‘V-01M’ using HPLC and mass spectrometry. A total of nine carotenoids were detected, which could be divided into two subgroups: carotenes (orange pigments) and xanthophylls (yellow pigments). Te carotenes included α-carotene, β-carotene, lycopene, and capsanthin, while the xanthophylls included lutein, violaxanthin, zeaxanthin, neoxanthin, and antheraxanthin. Te xanthophylls was signifcantly more abundant in the yellow mutant ‘V-01M’ than in the orange line ‘V-01’ (Fig. 1C,D). In ‘V-01M’, the contents of all fve xanthophylls were signifcantly higher than in ‘V-01’, especially for lutein and zeaxanthin (Fig. 1D). In contrast, no signifcant diference of carotenes were detected in ‘V-01’ and ‘V-01M’ (Fig. 1C). Tese results showed that the higher accumulation of yellow pigments (xanthophylls) in the ‘V-01M’ mutant likely resulted in its yellow petal color. Tis accumulation of xanthophylls could be caused by the promotion of the biosynthesis pathway or the repression of the degradation pathway.
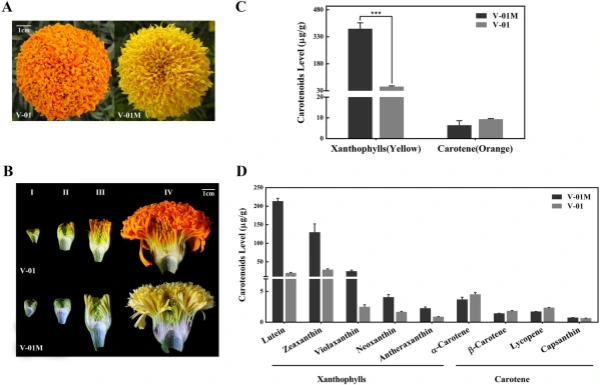
Figure 1. Carotenoid accumulation in ‘V-01’ and ‘V-01M’ marigold petals. (A) Te fowers of the ‘V-01’ line are orange, while its natural mutant ‘V-01M’ is yellow. (B) Te four stages of foral development in marigold ‘V-01’ and ‘V-01M’, shown using longitudinal cross-sections of the fowers. (C) Te accumulation of carotenoids in the fowers of ‘V-01’ and ‘V-01M’ at developmental Stage IV. Te error bars represent the standard error of three biological replicates. Asterisks indicate signifcant diferences according to a Student’s t-test (*P < 0.001). (D) Te accumulation of xanthophylls and carotenes in marigold ‘V-01’ and ‘V-01M’ at developmental Stage IV. Te error bars represent the standard error of three biological replicates.
Illumina sequencing, de novo assembly, and functional annotation. To elucidate the mechanism of fower color biosynthesis and carotenoid metabolism in marigold, we conducted the de novo sequencing of the orange and yellow varieties. A total of 24 RNA libraries were constructed from the fowers of the two lines (‘V-01’ and ‘V-01M’) at the four developmental stages, with three biological replicates for each stage (Supplementary Table S1). We obtained 132.954 Gb of clean data, which were used to assemble a de novo transcriptome using Trinity. Te assembly results led to the identifcation of 65,015 transcripts with an average length of 1130 bp, a GC content of 39.75%, and a N50 score of 1635 bp. Tese 65,015 transcripts belonged to 49,217 unigenes, which had an average length of 1015 bp, a GC content of 40.1%, and a N50 score of 1501 bp (Table 1). Te size distribution of the transcripts and unigenes are given in Fig. 2, with 43.53% and 37.28% of all transcripts and unigenes showing lengths greater than 1 kb, respectively. Gene function was annotated based on the homology of the unigenes to sequences listed in the following databases: Swiss_Prot, TrEMBL, NR, Pfam, KOG, GO, and KEGG. Putative homologs were identifed for 33,810 of the unigenes (68.70%) in the NR database, while 33,646 (68.40%), 27,502 (55.90%) 28,629 (58.20%), 22,558 (45.8%), 27,020 (54.90%), and 9790 (19.90%) unigenes showed signifcant similarity to sequences in the TrEMBL, Pfam, KOG, Swiss_Prot, GO, and KEGG databases, respectively (Table 2). Among the 33,810 unigenes with a match in the NR database, 8.8% were most similar to sequences from grape (Vitis vinifera), followed by sesame (Sesamum indicum; 7%), robusta cofee (Cofea canephora; 6.2%), and wild tobacco (Nicotiana tomentosiformis; 4.3%) (Fig. 3A). Te predicted function and gene classifcation of the marigold unigenes were identifed using.
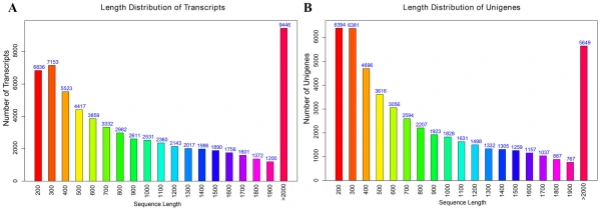
Figure 2. Length frequency distribution of assembly transcripts and unigenes. (A) Length distribution of transcripts. (B) Length distribution of unigenes.
the KOG and GO databases. A total of 1779 unigenes were annotated as ‘signal transduction mechanisms’ based on the KOG database, and the most common category was ‘general function prediction only’ (3200 unigenes) (Fig. 3B). Furthermore, the unigenes were annotated with GO terms, with the most common biological process categories determined to be ‘metabolic process’ and ‘cellular process’ (Fig. 3C). Expression dynamics of the DEGs during fower development. Cufinks sofware was used to identify DEGs between the four developmental stages in both of the marigold genotypes. Te FPKM values were used to estimate the gene expression levels, and volcano plots were constructed to describe the distribution of all DEGs identifed in the library comparisons (Fig. 4). Tese results indicated that, in both ‘V-01’ and ‘V-01M’, the most dramatic change in the expression of the genes occurred between developmental Stages I to III, as well as the comparison between Stages I and IV. Tis suggested that a large number of genes are signifcantly diferentially expressed throughout fower development. Furthermore, the fold changes in the expression of the DEGs between Stages II and III were greater than those of the DEGs from the comparison of Stages I and II in both ‘V-01’ and ‘V-01M’, suggesting that a more dramatic change in gene expression occurred between Stages II and III than between Stages I and II. Similarly, signifcantly fewer DEGs (1513) were identifed in V-01_I_VS_V-01_II (the comparison between Stages I and II in ‘V-01’) than in V-01_II_VS_V-01_III (4891) and V-01_III_VS_V-01_IV (7488), and comparisons of these stages in the mutant plant ‘V-01M’ also followed a similar DEG pattern (Fig. 5; Supplemental Table S2). Tis suggested that Stages II and III are the key phases of fower development with the most dramatic changes in gene expression. Tis is consistent with the observed accumulation of carotenoids and the color changes in the marigold fowers beginning in Stage III (Fig. 1B). Te coloring of the ligulate marigold fowers began at Stage III, and the ‘V-01’ (orange) and ‘V-01M’ (yellow) began to visibly diferentiate during this stage. Te most dramatic changes in gene expression, both in fold change (Fig. 4) and the number of DEGs (Fig. 5), occurred between the fower development Stages II and III. We therefore performed a detailed comparative analysis of the DEGs in Stages II and III (V-01_II_VS_V-01_III and V-01M_II_VS_V-01M_III), during which the ligulate fowers transitioned into the critical period of color formation. Finally, 4891 DEGs (2369 upregulated and 2522 downregulated) were identifed in the V-01_II_VS_V-01_III comparison and 4189 (2453 upregulated and 1736 downregulated) were identifed in the V-01M_II_VS_V-01M_III comparison (Fig. 5; Supplemental Table S2). Te similar number of DEGs between these two comparisons was likely a refection of their similar genetic backgrounds. We further used a KEGG analysis for the functional classifcation and pathway assignment of the DEGs between Stages II and III in both ‘V-01’ and ‘V-01M’. For V-01_II_VS_V-01_III, a total of 904 upregulated DEGs and 609 downregulated DEGs were grouped into the KEGG pathways. Similarly, 778 upregulated DEGs
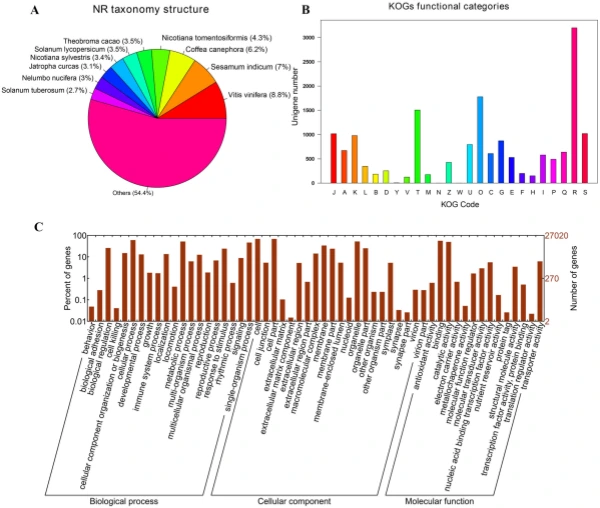
Figure 3. Characteristic analysis of annotated unigenes. (A) Species distribution of the top BLAST hits for each unique sequence. (B) Functional classifcation of marigold unigenes in KOG categories. Te categories: J, Translation, ribosomal structure and biogenesis; A, RNA processing and modifcation; K, Transcription; L, Replication, recombination and repair; B, Chromatin structure and dynamics; D, Cell cycle control, cell division, chromosome partitioning; Y, Nuclear structure; V, Defense mechanisms; T, Signal transduction mechanisms; M, Cell wall/membrane/envelope biogenesis; N, Cell motility; Z, Cytoskeleton; W, Extracellular structures; U, Intracellular trafcking, secretion, and vesicular transport; O, Posttranslational modifcation, protein turnover, chaperones; C, Energy production and conversion; G, Carbohydrate transport and metabolism; E, Amino acid transport and metabolism; F, Nucleotide transport and metabolism; H, Coenzyme transport and metabolism; I, Lipid transport and metabolism; P, Inorganic ion transport and metabolism; Q, Secondary metabolites biosynthesis, transport and catabolism; R, General function prediction only; S, Function unknown. (C) Functional classifcation of marigold unigenes enriched in GO terms.
and 519 downregulated DEGs from the V-01M_II_VS_V-01M_III comparison were grouped into the KEGG pathways. Te most signifcantly enriched pathways associated with the DEGs were “metabolic pathways” and “biosynthesis of secondary metabolites” in both ‘V-01’ and ‘V-01M’ (Fig. 6), suggesting a potentially important role for secondary metabolites in foral development. Identifcation of genes involved in carotenoid biosynthesis and degradation. Carotenoids are major pigments in marigold fowers, and the difering carotene (orange pigments) and xanthophyll (yellow pigments) contents in diferent genotypes largely contribute to the diversity of their fower colors. According to the KOG classifcation, about 2.2% of transcripts in the marigold fowers were assigned to the secondary metabolite biosynthesis category (Fig. 3B). Many of these encoded enzymes known to catalyze the biosynthesis of various carotenoids, including α-carotene, β-carotene, lycopene, capsanthin, lutein, violaxanthin, zeaxanthin, neoxanthin, and antheraxanthin.
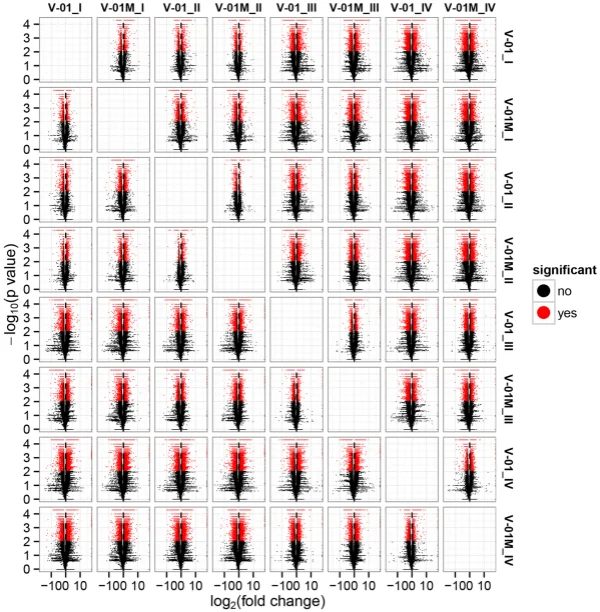
Figure 4. Volcano map of diferentially expressed genes in a comparison of 24 libraries, which were constructed from the fowers of the two lines (‘V-01’ and ‘V-01M’) at the four developmental stages (e.g. V-01_I indicates the fower development stage I of V-01 and so on). Te abscissa represents the level of fold change of the diferentially expressed genes. Te ordinates represents the signifcance level of the gene expression changes. Signifcantly diferentially expressed genes are shown as red dots, while those with no signifcant diference are shown as black dots.
To elucidate the genetic regulatory mechanism of marigold pigment accumulation, the genes involved in the carotenoid biosynthesis pathway were identifed according to the annotations of the transcriptome data. Te frst step in carotenoid biosynthesis is the conversion of colorless phytoene to red lycopene. Te enzymes involved in this step were identifed in the marigold transcriptomes, including PDS (TR15738), Z-ISO (TR8655), ZDS (TR6555), and CRTISO (TR5914). Lycopene is then catalyzed into carotene by the cyclases LCY-B and LCY-E, which were also identifed in the marigold transcriptomes (LCY-B (TR13418) and LCY-E (TR11756)). Carotene can be further catalyzed to produce a number of xanthophylls, including lutein, zeaxanthin, violaxanthin, and neoxanthin, which involves the genes HYD-B (TR20167) and HYD-E (TR27505). Finally, in addition to their biosynthesis pathway, three CCD genes (TR9765, TR16287, and TR24544) and four NCED genes (TR2330, TR3442, TR4240, and TR22914), all of which catalyze the degradation of the carotenoids, were identifed in the transcriptome data (Table 3). Among the three identifed CCD genes, TR9765 is phylogenetically close to Arabidopsis AtCCD1, whereas both TR16287 and TR24544 are close to AtCCD7. Te enzymes encoded by these proteins are likely involved in the biosynthesis and degradation of carotenoids. Te change in their expression may therefore be vital for the fnal color of the marigold fowers (Fig. 7). Transcriptome dynamics of genes involved in carotenoid biosynthesis. During the four stages of fower development, most of the genes involved in carotenoid biosynthesis and degradation were diferentially regulated. Four genes encoding enzymes that catalyze the conversion of phytoene into lycopene, PDS (TR15738), Z-ISO (TR8655), ZDS (TR6555), and CRTISO (TR5914), were signifcantly upregulated in Stages III and IV (Fig. 7). Similarly, LCY-B (TR13418), LCY-E (TR11756), HYD-B (TR20167), and HYD-E (TR27505) were upregulated in Stages III and IV. Te upregulation of the carotenoid biosynthesis genes probably refects the
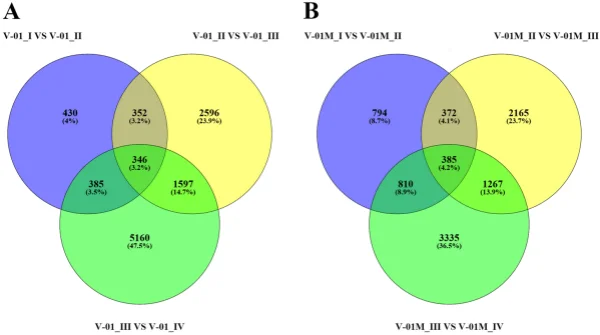
Figure 5. Venn diagram of the number of diferentially expressed genes in the four stages of marigold (A) ‘V-01’ and (B) ‘V-01M’ fower development. Te genes in overlapping sets show a diferential expression in two or three comparison pairs.
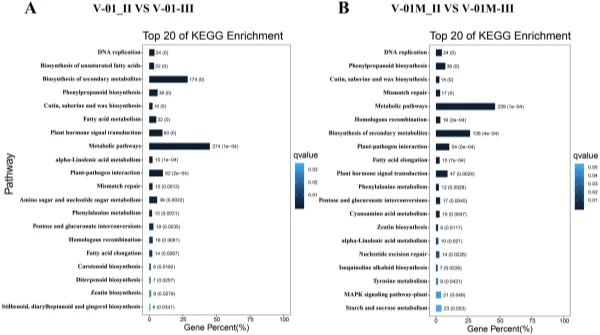
Figure 6. KEGG enrichment of diferentially expressed genes in a comparison between Stages II and III of marigold fower development in ‘V-01’ and ‘V-01M’
pigmentation of the fowers at developmental Stages III and IV, during petal expansion. Both ‘V-01’ and ‘V-01M’ have a similar expression pattern of these genes. Carotenoid degradation genes are diferentially expressed between ‘V-01’ and ‘V-01M’. To determine the causal genes responsible for the diferent accumulation patterns of carotenoids in ‘V-01’ and ‘V-01M’, we compared their expression patterns of the carotenoid biosynthesis genes. Te genes catalyzing phytoene to lycopene, including PDS (TR15738), Z-ISO (TR8655), ZDS (TR6555), and CRTISO (TR5914), are more highly expressed in ‘V-01’ than ‘V-01M’ in developmental Stages III and IV (Fig. 7).
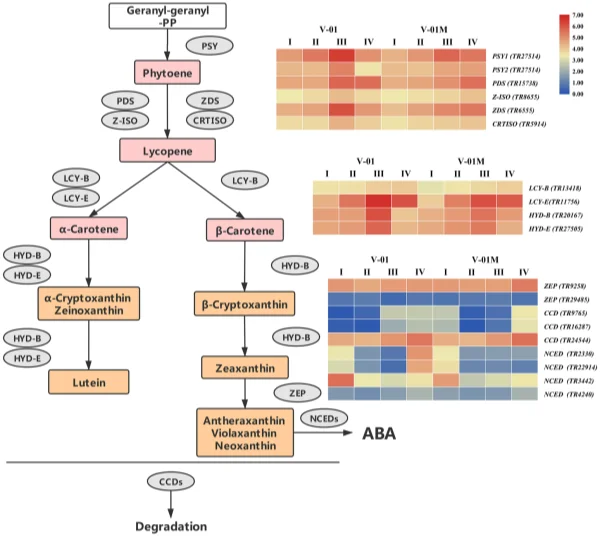
Figure 7. Expression patterns of genes encoding enzymes putatively involved in the biosynthesis and degradation of carotenoids in the marigold fowers. Gene expression levels in the four fower developmental stages in both marigold ‘V-01’ and ‘V-01M’ are represented by heat maps. PSY phytoene synthase, PDS phytoene desaturase, Z-ISO 15-cis-zeta-carotene isomerase, ZDS zeta-carotene desaturase, CRTISO prolycopene isomerase, LCY-B lycopene beta cyclase, LCY-E lycopene epsilon cyclase, HYD-B beta-ring hydroxylase, HYD-E carotene epsilon-monooxygenase, ZEP zeaxanthin epoxidase, CCD carotenoid cleavage dioxygenase, NCED 9-cis-epoxycarotenoid dioxygenase.
Te ‘V-01M’ fowers accumulated signifcantly more xanthophylls than ‘V-01’ (more than a ten-fold diference); therefore, we also investigated their expression of HYD-B (TR20167) and HYD-E (TR27505), which are involved in the biosynthesis of a series of xanthophylls. Surprisingly, no signifcant diference was observed in the expression of either HYD-B or HYD-E between ‘V-01’ and ‘V-01M’ in any of the four developmental stages, suggesting that this is not the reason for the color diferences observed in these lines. We next examined the expression of the genes responsible for xanthophyll degradation, the most important of which encode the CCD enzymes. Among the three CCD genes identifed in our transcriptome data, TR9765 was noticeably downregulated (8.96-fold decrease) in ‘V-01M’ compared with ‘V-01’ at developmental Stage III. Similarly, another CCD gene, TR16287, was expressed to a level 4.30 times lower in ‘V-01M’ than in ‘V-01’ at developmental Stage III (Fig. 7). In contrast, these two genes are less down-regulated in ‘V-01M’ compared with ‘V-01’ in stage IV. Tis may be involved in feedback regulation of degradation genes refex by the high accumulation of carotenoid in ‘V-01M’. In addition to the CCDs, the degradation of zeaxanthin also involves the NCEDs. At developmental Stage IV, two of the four NCED genes identifed in the marigold transcriptome were expressed at a dramatically lower level in ‘V-01M’ than in ‘V-01’; 22.62-fold and 12.35-fold decreases were observed in the expression of TR22914 and TR2330, respectively, in the mutant fowers (Fig. 7). Te CCDs and NCEDs are the enzymes responsible for the degradation of xanthophylls; therefore, the low expression of CCDs and NCEDs in the ‘V-01M’ mutant likely resulted in its accumulation of xanthophylls and consequently the yellow color of its fowers. Discussion Carotenoids play an important role in photosynthesis, and their degradation produces a series of plant volatiles, as well as strigolactones and abscisic acid p hytohormones1,2 . Moreover, carotenoids are widely used in the food and pharmaceutical industry; for example, lutein and similarly structured carotenoids can protect retinal cells in the eye against oxidative stress, and a number of studies have suggested that the supplementation of lutein can maintain eye health and lower the risk of various chronic eye d iseases3 . Lutein is the major pigment in marigold petals, making this plant one of the most important sources of this xanthophyll in the pharmaceutical industry. In some cultivars, lutein can account for approximately 90% of the total carotenoids in the marigold petals7 ; however, the lutein contents of the diferent varieties of marigold can vary substantially, with more than 100-fold diferences detected between some l ines8 . Many studies have therefore examined the genetic regulation of carotenoid accumulation in marigolds, which are considered a model plant for analysis of this pathway. We further elucidated the marigold carotenoid metabolic pathway by comparing an orange inbred line ‘V-01’ and its yellow mutant ‘V-01M’. A number of carotenoid substances were detected in both marigold lines, with the xanthophylls such as lutein, zeaxanthin, antheraxanthin, neoxanthin, and violaxanthin being signifcantly more abundant in the yellow mutant ‘V-01M’ than in ‘V-01’. Tese yellow substances accounted for 95.98% of the total carotenoid content in ‘V-01M’ but only 40.44% of the total carotenoid content in ‘V-01’, suggesting that changes in the relative abundance of the carotenoids directly afect the color of marigold fowers. To explore the genetic pathways involved in carotenoid accumulation in ‘V-01’ and ‘V-01M’, we performed transcriptome sequencing and a diferential expression analysis. Few previous studies have examined the marigold transcriptome, and fewer still have explored the transcriptomic diferences associated with particular fower color traits. In 2018, the transcriptomes of marigold buds was sequenced to develop simple sequence repeat (SSR) markers15 . In this study, we performed de novo sequencing on the four stages of fower development in both the orange and yellow marigold varieties. Te resulting high-quality sequencing data, unigene assembly, and annotations provide new resources for future marigold research and serve as a basis for eforts to improve this important ornamental crop. ‘V-01’ and ‘V-01M’ are isogenic, meaning that most of the DEGs identifed, particularly in the pigment biosynthesis pathways, are the consequences or causes of the observed diferences in their xanthophyll accumulation. Two enzymes, HYD-B and HYD-E, are crucial for the catalysis of carotene and the production of xanthophylls, including lutein. Knocking out either HYD-B or HYD-E was previously shown to afect the biosynthesis of lutein in A rabidopsis16 . Based on our transcriptome analysis, we revealed that the expression levels of HYD-B and HYD-E gradually increased during the development of the marigold fowers, which was consistent with their pigmentation progression. In both ‘V-01’ and ‘V-01M’, the expression patterns of HYD-B and HYD-E were similar throughout fower development, with no signifcant diferences between the two genotypes. In contrast, the genes encoding enzymes important for the degradation of the xanthophylls, included two CCDs and two NCEDs, were found to be diferently expressed in ‘V-01’ and ‘V-01M’. Te dramatically low expression of these four carotenoid degradation genes in the yellow mutant ‘V-01M’ might lead to the high accumulation of all xanthophylls in its petals. Similarly, in strawberry (Fragaria × ananassa) fruit, previous studies revealed a correlation between the increased expression of FaCCD1 during ripening and a decrease in the lutein content 9 . In addition, the RNAi-mediated silencing of CCD4a in Chrysanthemum morifolium increased the lutein content in its petals, changing them from white to yellow17 . conclusions Here, we performed an analysis of the transcriptome and metabolites to investigate the molecular and genetic causes of the diferent fower colors observed in the orange ‘V-01’ marigold line and its isogenic yellow mutant ‘V-01M’. Tese investigations showed that xanthophylls accumulate in the yellow ‘V-01M’ fowers, and led to the identifcation of a set of genes involved in carotenoid biosynthesis. We did not identify a signifcant diference in the expression of the xanthophyll biosynthesis genes HYD-B and HYD-E between ‘V-01’ and ‘V-01M’; however, the dramatically reduced expression of the CCDs and NCEDs in ‘V-01M’ might limit the degradation of the xanthophylls, resulting in the yellow petal coloration. Tis work also provides a transcriptome database for the study of marigold, an economically important ornamental plant. Methods plant materials. Te marigold (Tagetes erecta L.) inbred line ‘V-01’ (orange petals) and its natural mutant ‘V-01M’ (yellow petals) (Fig. 1A) were grown in a climate chamber at 22 °C with 70% relative humidity and a 16-h/8-h day/night photoperiod. Flower development was divided into four stages: pre-fowering (I), unopened fower (II), semi-open fower (III), and full fowering (IV) (Fig. 1B). Flowers were harvested from both plants at these four developmental stages, immediately frozen in liquid nitrogen, and stored at – 80 °C until required for the metabolites and transcriptomic analyses. Tree replicates were prepared for each sample. Pigment extraction. Petals (100 mg fresh weight) were frozen in liquid nitrogen, ground into powder, and extracted with a solution of n-hexane:acetone:ethanol (2:1:1, v/v/v). Te extract was vortexed for 30 s, then an ultrasound-assisted extraction was carried out for 20 min at room temperature. Te extract was centrifuged at 12,000 rpm for 5 min, afer which the supernatant was collected and evaporated under a nitrogen gas stream. Te extract was then reconstituted in 75% (v/v) methanol and centrifuged, and the supernatant was collected for the liquid chromatography-mass spectrometry (LC–MS) analysis. carotenoid metabolites analysis. Te petal extracts were analyzed using an LC–ESI–MS/MS system (high-performance liquid chromatography (HPLC) Shim-pack UFLC SHIMADZU CBM30A system; MS, Applied Biosystems 6500 Triple Quadrupole). Te analysis was performed using YMC C30 columns (3 µm, 2 mm × 100 mm) and an acetonitrile:methanol (3:1, v/v) (0.01% BHT):methyl tert-butyl ether (0.01% BHT) solvent. Te solvent gradient was as follows: 85:5 (v/v) at 0 min, 75:25 V/V at 2 min, 40:60 (v/v) at 2 min 30 s, 5:95 (v/v) at 3 min, 5:95 (v/v) at 4 min, 85:15 (v/v) at 4 min, and 85:15 (v/v) at 6 min. Te fow rate was 0.8 mL/ min. Te temperature was maintained at 28 °C, and the injection volume was 5 μL. Te efuent was alternatively connected to an ESI-triple quadrupole-linear ion trap (Q TRAP)-MS (API 6500 Q TRAP LC/MS/MS System) equipped with an APCI Turbo Ion-Spray interface operating in a negative ion mode. Te equipment was controlled using Analyst 1.6.3 sofware (AB Sciex). Te APCI source operation parameters were as follows: ion source, turbo spray; source temperature 350 °C; curtain gas (CUR) was set at 25.0 psi; and collision gas (CAD) was medium. Te DP and CE settings were further optimized for individual MRM transitions. A specifc set of MRM transitions were monitored for each period, according to the plant hormones eluted. RNA sequencing and de novo assembly. Total RNA was isolated from the petals using an RNAprep Pure kit (Tiangen Biotech Co., Ltd., Beijing, China). Te RNA concentration was determined using a NanoDrop 2000 spectrophotometer (Termo Fisher Scientifc, Waltham, MA, USA) and an Agilent 2100 Bioanalyzer (Agilent Technologies, Santa Clara, CA, USA). RNA samples with an RNA integrity number (RIN) greater than 9 were used to construct the sequencing library using a NEB Next Ultra Directional RNA library prep kit, according to the manufacturer’s instructions (New England Biolabs, Ipswich, MA, USA). Te library preparations were sequenced on an Illumina Hiseq 2000 platform by ORI-GENE Technology Inc. (Beijing, China). Te raw sequencing data were fltered to remove low-quality reads that could afect the data quality and subsequent analysis. To this end, the reads were cleaned using FastQC sofware to remove the adaptors and poly-N-containing low-quality reads, as well as reads shorter than 40 bp. Te transcriptome was assembled using Trinity sofware with the min_kmer_cov set to 2, and all other parameters set to their defaults. Te assembled transcripts and unigenes were used for the subsequent annotation analysis. Diferential expression analysis. Te unigenes were functionally annotated by searching for homologs in a comparison against the public databases Swiss_Prot, Translated EMBL (TrEMBL), Non-redundant Proteins (NR), Protein Families Database (Pfam), Eukaryotic Orthologous Groups Database (KOG), Gene Ontology (GO), and Kyoto Encyclopedia of Genes and Genomes (KEGG)). Te number of fragments per kilobase of transcripts per million mapped reads (FPKM) was calculated for the quantifcation of the gene expression levels. Te abundance of the gene transcripts was calculated using Cufinks. Te cufdif command was used to flter out the diferential genes with a mapping read sum greater than 10 in both samples, |log2 (fold change)| > 1, P-value ≤ 0.05, and Q-value ≤ 0.05. GO and KEGG signifcant enrichment analyses was performed, and a hypergeometric test (phyper) was used to identify any GO/KEGG terms that were signifcantly enriched in the differentially expressed genes (DEGs) compared with all of the expressed genes (P-value < 0.05). Data availability Te sequencing raw data of this study was deposited in NCBI database (BioProject PRJNA562616). Te plant materials are available from the corresponding author on reasonable request.
Author contributions
Z.Z. and H.X. conceived and designed the experiments. H.L.Z., H.Z., F.L., and H.Q. performed the experiments. S.Z., Y.Z., X.C. and R.C. analyzed the data. Z.Z. and H.X. wrote the paper. All the authors have read and approved the fnal version of the manuscript.
References
- Villar-Martínez, A. A. D., Ma, R. & Paredes-López, O. Molecular Characterization of cDNAs encoding 3-hydroxy-3-methylglutaryl coenzyme A reductase in marigold (Tagetes erecta L.). J. Plant Physiol. 155(2), 205–211 (1999).
- Hirschberg, J. Production of high-value compounds: carotenoids and vitamin E. Curr. Opin. Biotechnol. 10(2), 186–191 (1999)。
- Peng, M.-L. et al. Infuence/impact of lutein complex (marigold fower and wolferry) on visual function with early age-related macular degeneration subjects: a randomized clinical trial. J. Funct. Foods 24, 122–130 (2016).
- He, Y. H., Ning, G. G., Sun, Y. L., Qi, Y. C. & Bao, M. Z. Identifcation of a SCAR marker linked to a recessive male sterile gene (Tems) and its application in breeding of marigold (Tagetes erecta). Plant Breed. 128(1), 92–96 (2010).
- Dwyer, J. H. et al. Oxygenated carotenoid lutein and progression of early atherosclerosis: the Los Angeles atherosclerosis study. Circulation 103(24), 2922–2927 (2001).
- Granado, F., Olmedilla, B. & Blanco, I. Nutritional and clinical relevance of lutein in human health. Br. J. Nutr. 90(3), 487–502 (2003).
- Tanaka, Y., Sasaki, N. & Ohmiya, A. Biosynthesis of plant pigments: anthocyanins, betalains and carotenoids. Plant J. https ://doi. org/10.1111/j.1365-313X.2008.03447 .x (2008).
- Moehs, C. P., Tian, L., Osteryoung, K. W. & Dellapenna, D. Analysis of carotenoid biosynthetic gene expression during marigold petal development. Plant Mol. Biol. 45(3), 281–293 (2001).
- Garcia-Limones, C. et al. Functional characterization of FaCCD1: a carotenoid cleavage dioxygenase from strawberry involved in lutein degradation during fruit ripening. J. Agric. Food Chem. 56(19), 9277–9285 (2008).
- Qin, X. & Zeevaart, J. A. D. Te 9-cis-epoxycarotenoid cleavage reaction is the key regulatory step of abscisic acid biosynthesis in water-stressed bean. Proc. Natl. Acad. Sci. 96(26), 15354–15361 (1999).
- Liu, L., Shao, Z., Zhang, M. & Wang, Q. Regulation of carotenoid metabolism in tomato. Mol. Plant 8(1), 28–39 (2015).
- 12. Ralf, W., Dirk, M., Tanja, V., Dean, D. & Peter, B. Transcription factor RAP22 and its interacting partner SINAT2: stable elements in the carotenogenesis of Arabidopsis leaves. Plant Physiol. 145(3), 1073–1085 (2007).
- Gabriela, T. O., Enamul, H. & Manuel, R. C. Direct regulation of phytoene synthase gene expression and carotenoid biosynthesis by phytochrome-interacting factors. Proc. Natl. Acad. Sci. U.S.A. 107(25), 11626–11631 (2010).
- Catherine, M., Julia, V., Petra, T. & Giovannoni, J. J. Te tomato MADS-box transcription factor RIPENING INHIBITOR interacts with promoters involved in numerous ripening processes in a COLORLESS NONRIPENING-dependent manner. Plant Physiol. 157(3), 1568–1579 (2011).
- Zhang, H. et al. Development of SSR molecular markers based on transcriptome sequencing of Tageteserecta. Acta Hortic. Sin. 45, 159–167 (2018).
- Fiore, A. et al. A quadruple mutant of Arabidopsis reveals a beta-carotene hydroxylation activity for LUT1/CYP97C1 and a regulatory role of xanthophylls on determination of the PSI/PSII ratio. BMC Plant Biol. 12, 50 (2012).
- Akemi, O., Sanae, K., Ryutaro, A., Satoshi, Y. & Katsuhiko, S. Carotenoid cleavage dioxygenase (CmCCD4a) contributes to white color formation in chrysanthemum petals. Plant Physiol. 142(3), 1193–1201 (2006).
Huali Zhang1,4 , Shiya Zhang2,4 , Hua Zhang1 , Xi chen3 , Fang Liang1 , Helan Qin1 , Yue Zhang1 , Richen cong1 , Haibo Xin1* & Zhao Zhang2
() ()